Easily find issues by searching: #<Issue ID>
Example: #1832
Easily find members by searching in: <username>, <first name> and <last name>.
Example: Search smith, will return results smith and adamsmith
Aqua Data Studio / nhilam |
Follow
827
|
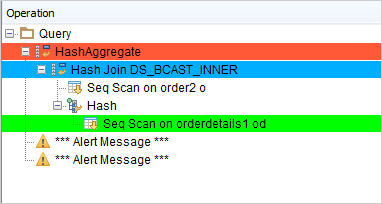
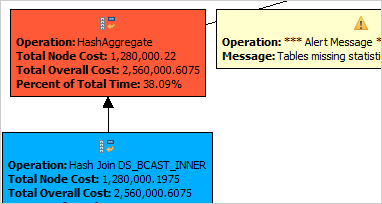
Visual Explain is now available for Amazon Redshift, giving you the details you need to track down query bottlenecks. The Visual Explain Diagram for Amazon Redshift allows you to click on operations in a flowchart-style diagram to view full operation details. Nodes are color-coded to help you identify what has the highest cost. Our Explain Plan Details in the Results Pane list operation details such as JOINs, SORTs and Seq Scan costs for quick viewing.
View detailed statistics of your executed query to track down bottlenecks.
In DBA Tools > Amazon Redshift > Instance Manager > Query History, view the execution plan for any previously executed query.
View a Visual Explain Diagram of your queries to see where executions bog down.
About AquaClusters Privacy Policy Support Version - 19.0.2-4 AquaFold, Inc Copyright © 2007-2017